Gust Energy — digital products for energy
Part of building energy technology and monitoring systems for the Turkish market
About the project
Gust Energy (gustenergy.com.tr) is a Turkish company working in energy. Diwave brought the engineering for their digital platforms.
Key areas
- ✓ Energy consumption monitoring
- ✓ Smart meters and IoT integration
- ✓ Real-time dashboards and analytics
- ✓ Energy-efficiency optimisation
- ✓ Alerting and recommendation systems
Technology
Diwave expertise
- • IoT architecture and telemetry
- • Real-time data processing
- • Visualising complex data
- • Alerting and monitoring systems
Results
- ✓ A scalable platform for energy monitoring
- ✓ Integration with IoT devices and meters
- ✓ Analytics and forecasting in production
- ✓ Lower consumption for the client
Focus area
Energy Monitoring, Smart Grids, IoT Integration, Predictive Analytics
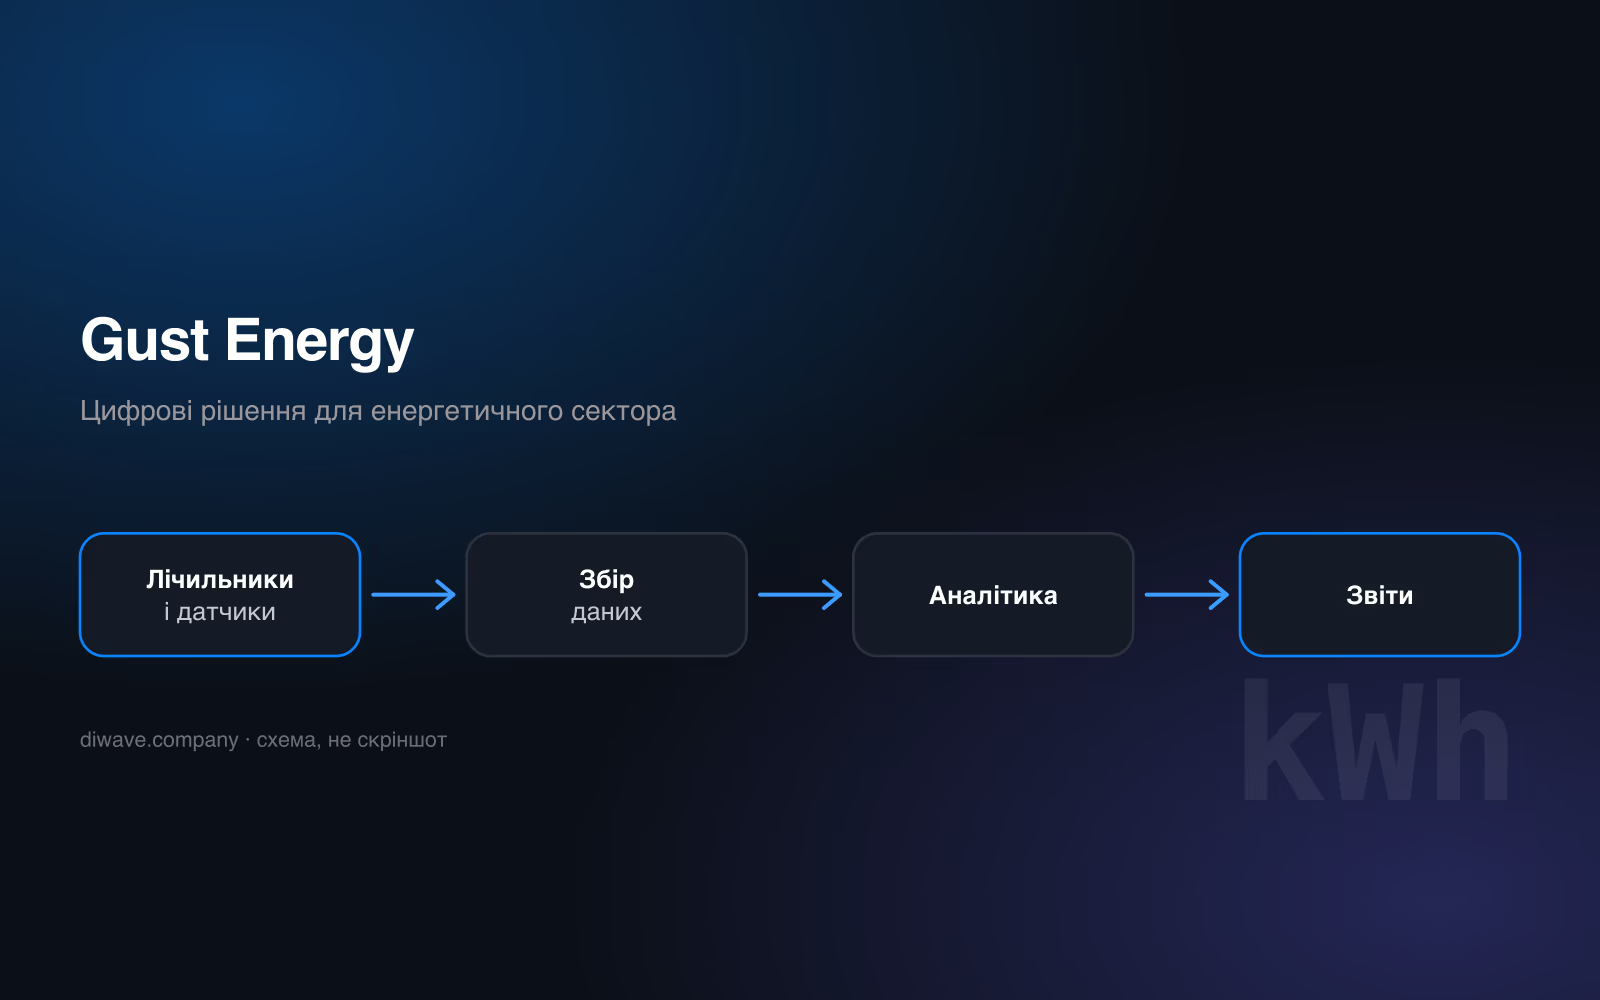
From a meter to a decision
A meter on its own only knows a number. The work is everything that happens after that number leaves the device: telemetry taken off the smart meter, processed as it arrives rather than overnight in a batch, and put on a dashboard while the reading still means something to the person looking at it.
That chain is what makes energy monitoring hard. Readings arrive constantly and from many points, so processing has to keep up with them in real time; the same data then has to be shown simply enough for an operator to read at a glance, which is the opposite requirement. Visualising complex data is a separate engineering job from collecting it, and here both live in one system.
Alerting is the third step and the only one that reliably changes anything. A dashboard is read when somebody opens it; an alert arrives whether or not anybody was looking. Anomaly detection is there so the alert rests on how a site actually behaves rather than on a threshold somebody typed in once and never revisited.
What to check before starting a similar project
- • What the readings are for. Monitoring, billing and efficiency optimisation look like the same data and impose different requirements on accuracy and retention.
- • How the meters connect, and what happens when they stop. Telemetry that has died must be visible as a fault, not as a flat line on a chart.
- • Who receives an alert, and what they are expected to do about it. An alert with no action behind it trains people to ignore the next one.
- • How much history the forecasting needs before it is worth trusting.
FAQ
What did Diwave do on this project?
The engineering behind the digital platforms: IoT architecture and telemetry, real-time data processing, the dashboards, and the alerting and monitoring systems.
Does it work with meters that are already installed?
The platform integrates with IoT devices and meters rather than replacing them; that integration is one of the results listed above.
What does anomaly detection add over ordinary thresholds?
A threshold catches what somebody already expected. Detection based on behaviour catches consumption that is wrong for this site at this hour even though no fixed limit was crossed, and that is where most efficiency losses live.